NEW Stats panel, CVD and Bar Replay →
See the order flow behind every candle.

Live CME order flow, drawn right on your TradingView chart. Big trades, absorption, exhaustion, delta and volume profile levels, with no extra platform.

Chrome extension · Any TradingView plan, even free · Cancel any time

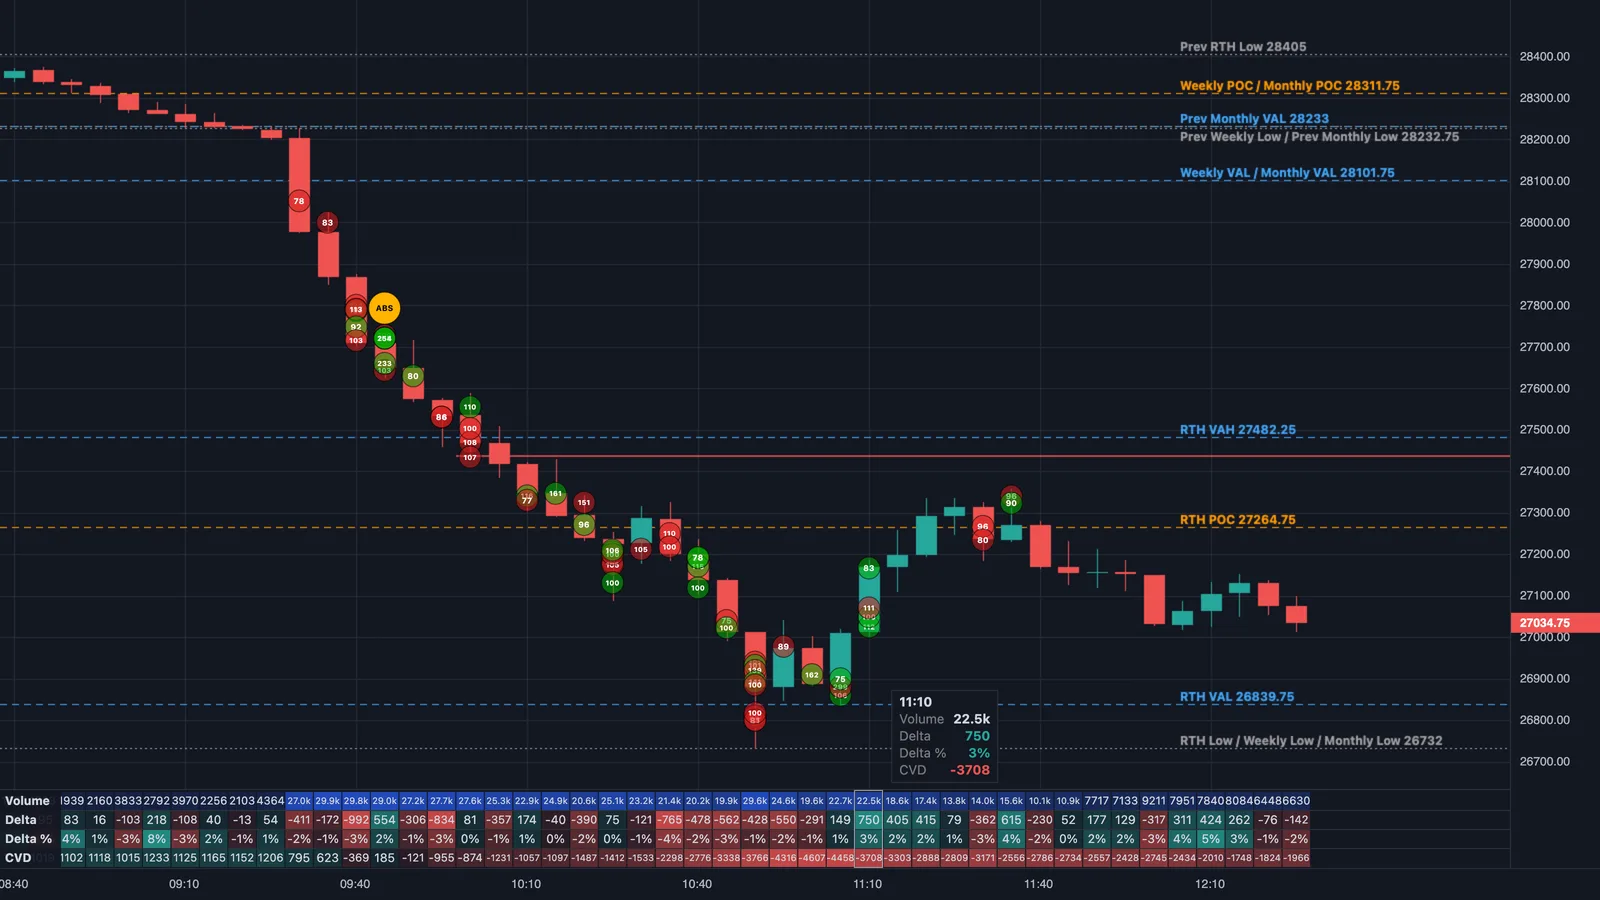
An NQ chart with volume profile levels, Big Trades bubbles, an absorption tag and the stats panel showing volume, delta and CVD under each candle
NQMNQESMES
What you get

Everything the tape is telling you.

Built from every CME trade, tick by tick. Every colour, size and label is yours to set.

Volume profile levels

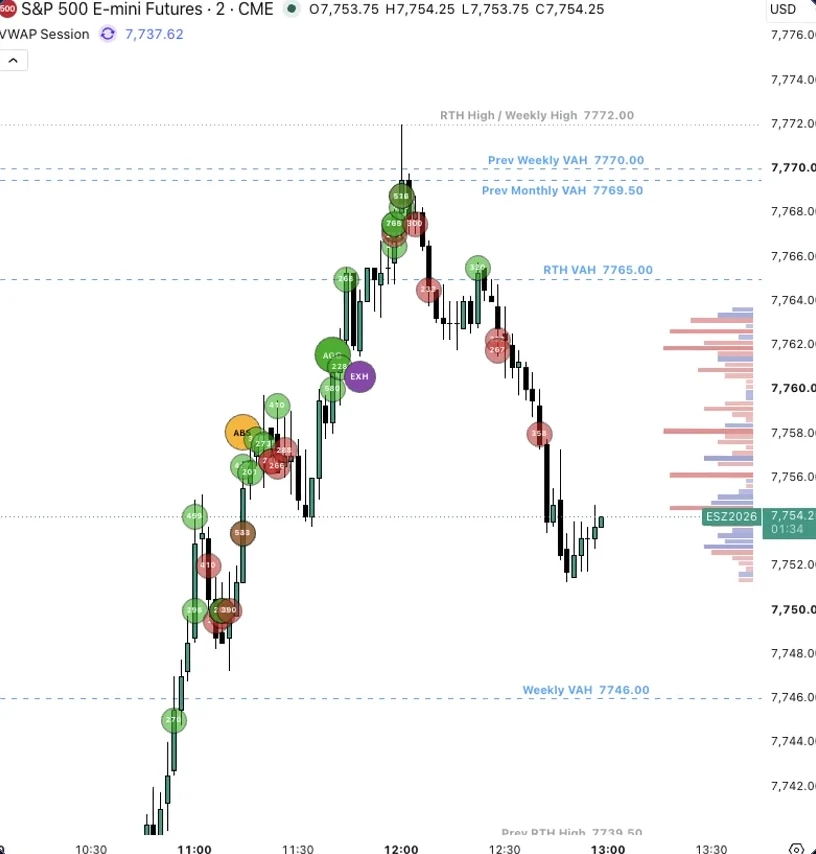
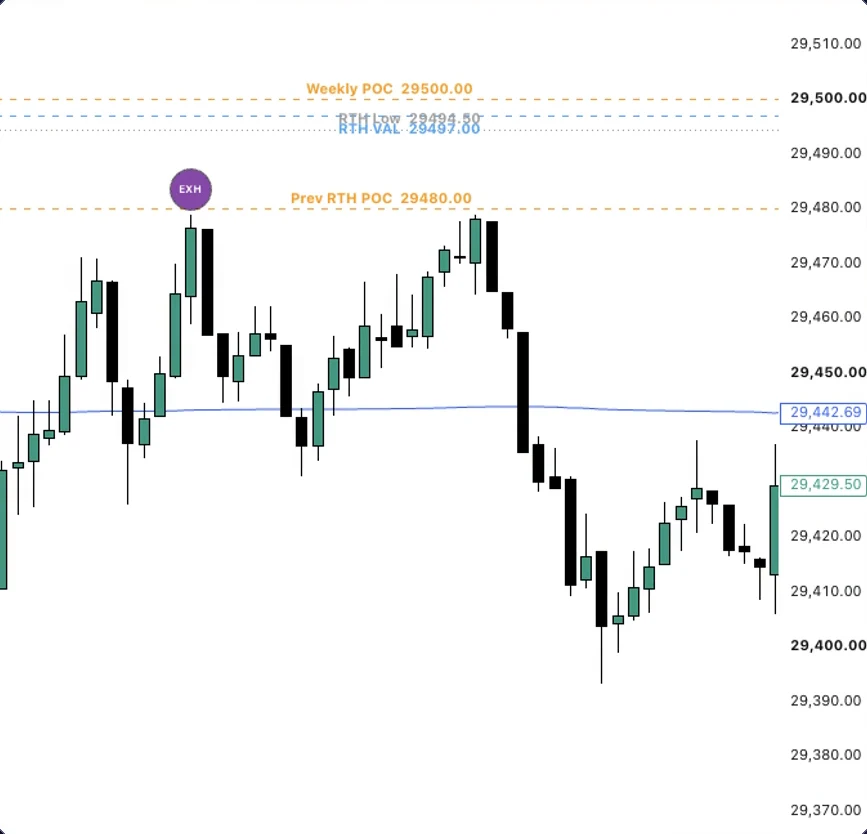
POC, VAH, VAL, High and Low for Globex, RTH, Weekly and Monthly, current and previous. Labels follow price.

Big Trades bubbles

Every large aggressive order on the candle and price it hit, with its size. Green for buyers, red for sellers.

Smart tags at key levels

What happened when size hit a level: absorbed, followed through, exhausted or trapped.

ABSAGGEXHTRAP

Delta imprint

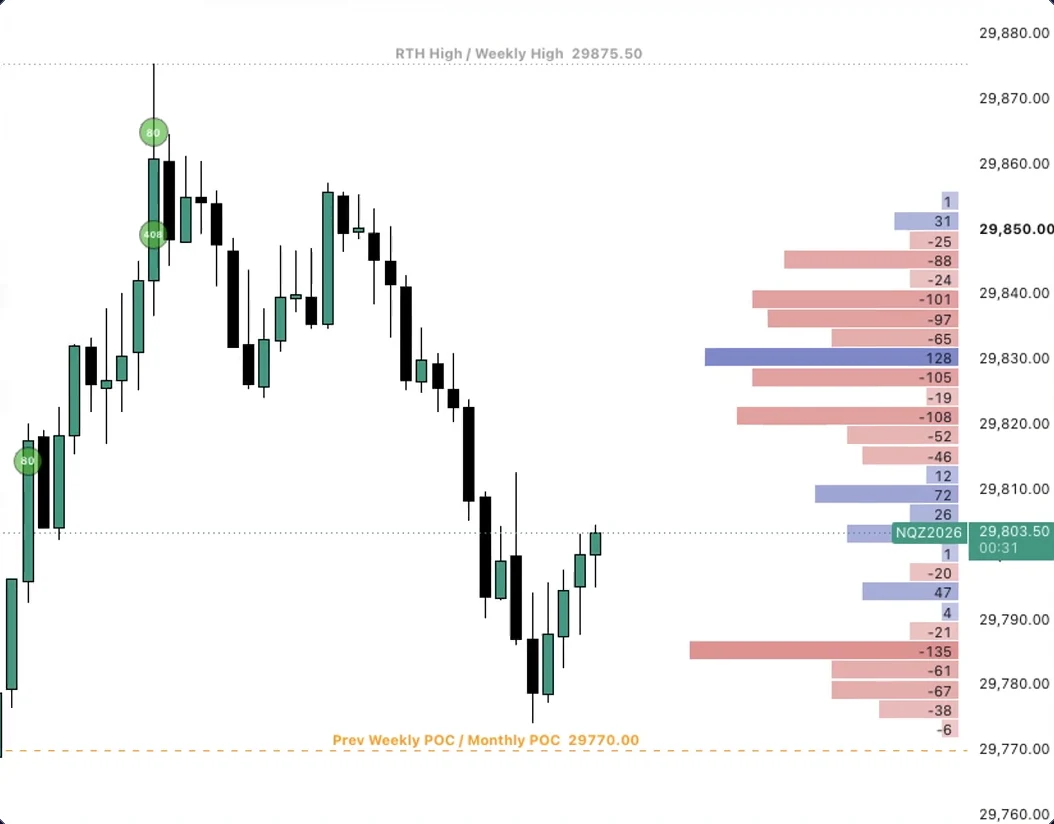
Buying minus selling at every price over the last 30 minutes, shaded right beside the candles.

Stats panel & CVDNEW

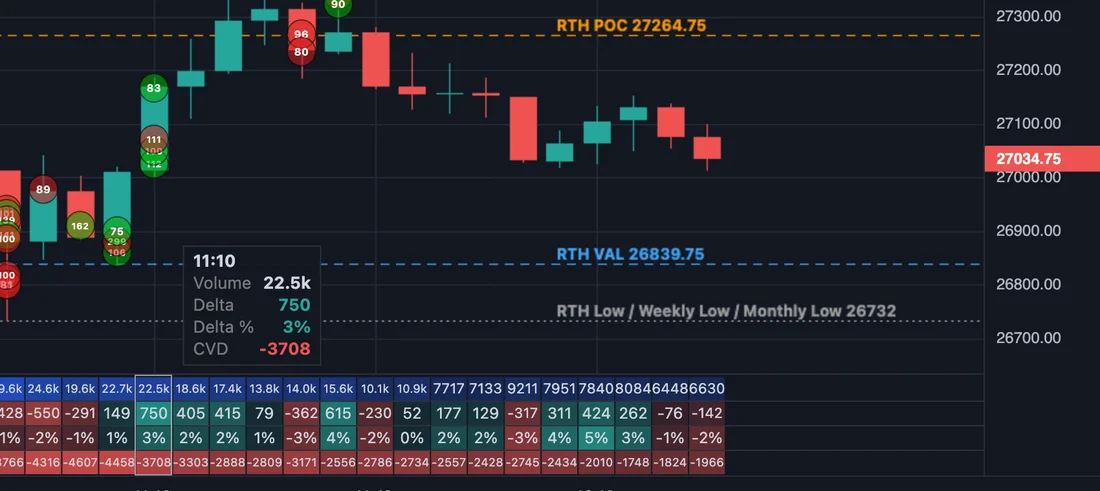
Volume, delta, delta % and cumulative delta under every candle, coloured by size. Hover any bar for its numbers.

Bar ReplayNEW

Replay past sessions in TradingView with all of it: levels, bubbles, tags, CVD and stats, minute by minute.

On your chart

Light theme or dark, NQ or ES.

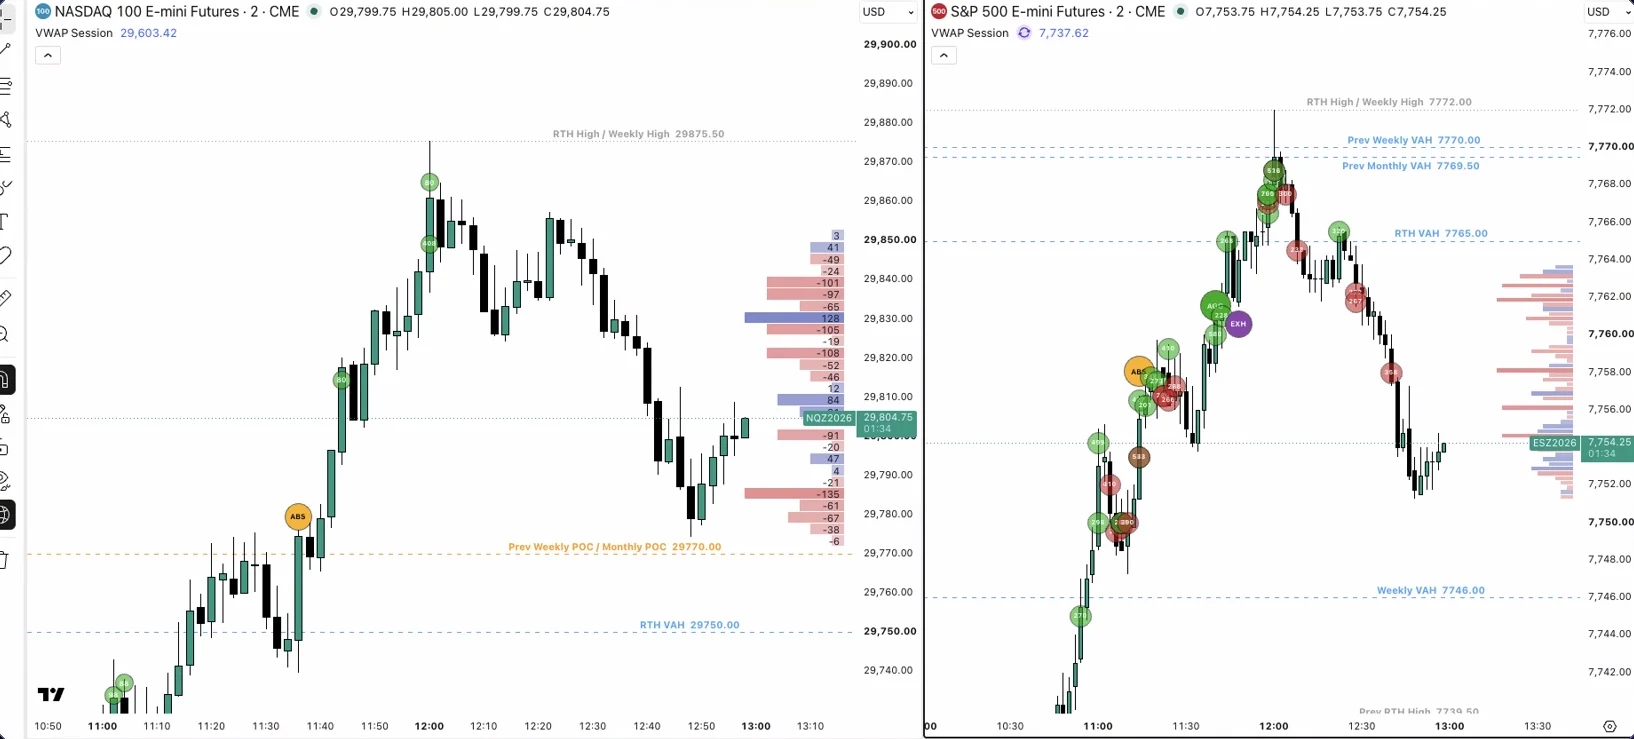
It draws on TradingView itself, so it fits your layout. Two charts side by side each get their own market's data.

NQ and ES charts side by side on a light TradingView theme, with volume profile levels, Big Trades bubbles, tags and the delta imprint
New · Bar Replay

Rewind any session. The order flow comes too.

Turn on TradingView's Bar Replay and Tapeflow follows it, bar by bar, exactly as it was at that minute.

  • The levels as they stood, including the developing session's
  • Bubbles and tags appear when they printed, not before
  • Stats, CVD and zones rebuilt to the minute
New · Stats panel

The numbers behind every bar.

A compact panel under your candles. Big cells stand out, so you see where volume and delta really came in.

  • Volume, Delta, Delta % and CVD, and more rows if you want them
  • CVD per session, so you can see the turn when sellers run out
  • Stacked imbalance zones on the chart, kept until price closes through
The stats panel with a readout for one candle: volume 22.5k, delta 750, delta 3%, CVD -3708
How it works

Running in two minutes.

Start the free trial

7 days free on Whop. Your license key is at whop.com/orders.

Add the extension

Install tRecordify OrderFlow Suite from the Chrome Web Store. Works in two browsers.

Activate on your chart

Open TradingView, click the tRecordify icon, paste the key and press Activate.

See it in action

One minute tour.

FAQ

Questions

Which markets does it cover?

NQ and ES, live Sunday 6 pm to Friday 5 pm New York time. MNQ and MES charts show NQ and ES data, which trade at the same prices, so everything lines up on the micros too.

Do I need a paid TradingView plan?

No. It works on any TradingView plan, including the free one, and uses no indicator slots. Nothing is saved to your layout.

Where does the data come from?

Every CME trade, tick by tick, with its price, size and which side was the aggressor. The levels, bubbles, tags and stats are all built from that.

Which days can I replay?

Finished sessions are prepared after each day's close and kept for replay. Start TradingView's Bar Replay on NQ, MNQ, ES or MES and the order flow follows it automatically.

Can I cancel?

Any time, from whop.com/orders. Cancel during the free trial and you won't be charged. After cancelling you keep access until the end of the period you've paid for.

Trade with the tape on your side.

7 days free. Then keep it, or cancel in a click.

Start your free trial